
Genome-wide associations of human gut microbiome variation and implications for causal inference analyses

| Name | Description | Download |
|---|---|---|
| Supplementary_Table_1 | Summary of analytical methods as published in previous human, 16S rRNA microbiome GWAS studies. The table includes publication details of the studies (the title, first author, website url), their sample size, 16S rRNA gene variable region amplified and sequenced, software or pipeline used to cluster 16S reads into taxonomic and/or operational taxonomic units (OUT). In addition, the number of microbial traits (MT) analyzed in the mGWAS, transformation applied to the MT abundance data, software or test applied to perform association between genotype and MT, and methodologies used to account for population structure and for multiple testing burden. | Download |
| Supplementary_Table_2 | Microbial trait data used in this study. The table includes individual level DADA2 integer count data for all phylogenetic levels (highlighted in green); the (zero-truncated)-abundance data rank normal transformed and regressed (RNTRes) against technical batch covariates, PC1-10, sex, and age (residuals extracted) (in blue); the derived presence (1) or absence(0) (P/A) hurdle binary (HB) data for zero-inflated counts (yellow); and the diversity metrics, untransformed or regressed and enterotype calls. | Download |
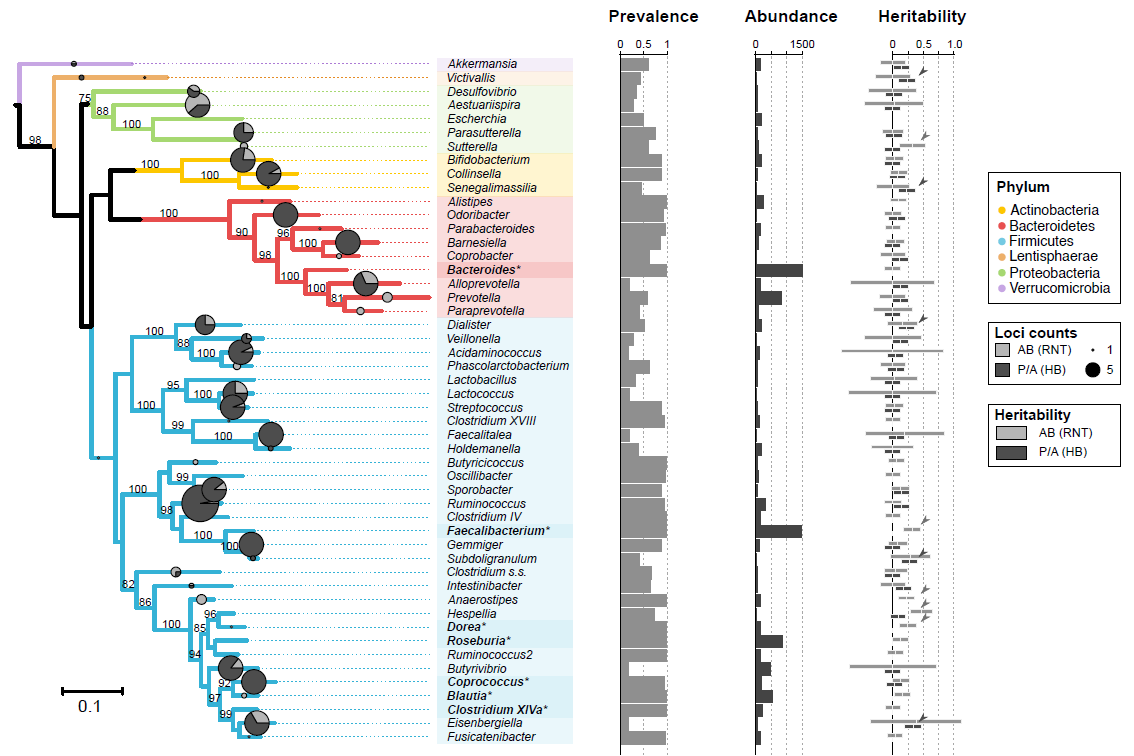
| Supplementary_Table_3 | GWAS taxa (92) result summaries. The table contains the 92 taxon used in the mGWAS with their corresponding phylogenetic description (phylum, class, order, family, genus), prevalence and abundance in FGFP, the number of sites and loci associated with each taxon derived from the meta-analysis, and from FGFP alone. In addition, the heritability point estimates, standard errors, and p-values for presence/absence (P/A), rank normal transformed abundances (AB), as well as log and box-cox transformations of the integer count data for cross study comparison. | Download |
| Supplementary_Table_4 | Results for association analysis for CNVs against all MTs. The table includes all the CNV included in the GWAS and provided results for: (1) specific CNVs, as called by PennCNV (CNV_GWAS); (2) burned GWAS performed in 1 million base pair non-overlapping windows (CNV_Burden_GWAS), (3) a global burden GWAS, calculated as sum of all CNV counts (CNV_GlobalBurden_GWAS); and (4) a global burden GWAS of rare CNVs, calculated as the sum of all CNV counts for CNVs observed variable in less than 1% of the FGFP population (CNV_RareGlobalBurden). | Download |
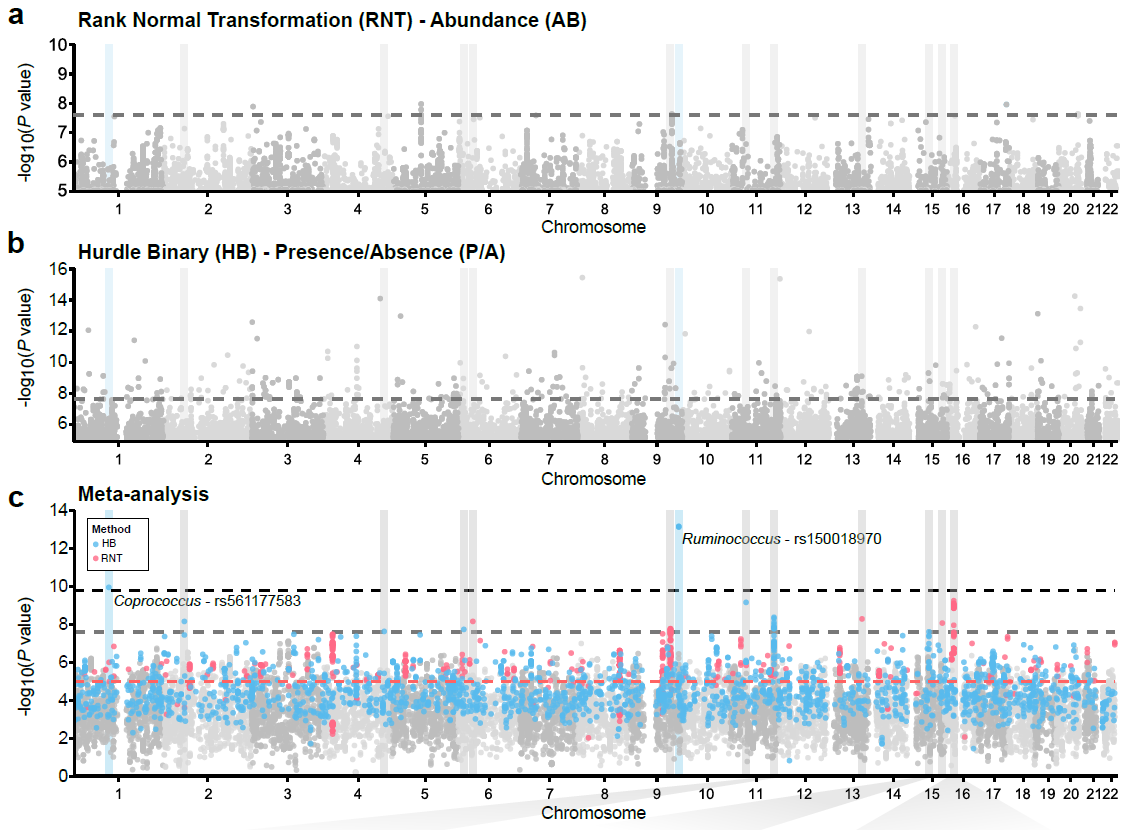
| Supplementary_Table_5 | Results and annotation for all 3,321 meta-supported associations. Meta-supported associations refer to those with smaller p-value in the meta-analysis compared to FGFP alone. The table includes the microbial traits, rsids, snpids, a flag (TagLocus) indicating if a variant is a locus tag or top result in a linkage disequilibrium block, parameter estimates for the meta-analysis, FGFP, FoCUS and PopGen including, beta, se, association p-value, sample size, variant info score, minor allele frequency, effect allele frequency, and annotation of variants with DEPICT, and ENSEMBL v75 via biomaRt. | Download |
| Supplementary_Table_6 | See Supplementary Information. | Download |
| Supplementary_Table_7 | Catalog of MT-SNP matched hits previously reported in mGWAS associations. The table provides the estimates for the like or a higher order taxonomic level microbial trait, when available, from the FGFP (-method score) alongside the publicly available data from previous studies. | Download |
| Supplementary_Table_8 | Catalog of top hits previously reported in mGWAS associations. Estimates for the STONGEST associated (smallest p-value, REGARDLESS OF THE TRAIT) microbial trait, when available, from the FGFP (-method score) is provided alongside the publicly available data from previous studies. | Download |
| Supplementary_Table_9 | The effect estimates for all FGFP microbial traits at the MCM6 rs4988235 variant. The table includes MT as defined by FGFP, the rsid in FGFP, the SNPID in FGFP, defined as a compound identifier of chromosome:basepair_allele1_allele2, chromosome as reported by FGFP, base position as reported by FGFP (hg19), reference allele in FGFP, effect allele in FGFP, minor allele frequency in FGFP, imputation information score in FGFP, beta or effect estimate for the MT, standard error in FGFP, p-value in FGFP. | Download |
| Supplementary_Table_10/td> | Results derived from PhenoScanner V2 analysis. The output for the 14 SNP-microbial traits associations that surpass the genome-wide significance threshold or may be considered replicated. The table includes the microbial trait (mt), SNP ID (snpid: abbreviated as the chromosome, base pair (GRCh37), non-effect allele, and effect allele), the dbSNP SNP reference ID (rsid), the trait reported by PhenoScanner to be previously associated with the SNP, the type of trait previously associated (Trait), the pubmed ID (PMID) to the study if available, the effect estimate reported (Beta), the p-value reported (P), the sample size reported (N), the reported units of the effect estimates (Unit), and repeated details if a second trait was also linked to the same SNP. | Download |
| Supplementary_Table_11 | Results derived from PhenoScanner V2 analysis. Including all previously reported GWAS associations for the top 14 variants at a p-value threshold of 0.01 (PhenoScanner_GWAS); all previously reported expression quantitative loci associations, (PhenoScanner_eQTL) and all previously reported methylation quantitative loci associations (PhenoScanner_methQTL). | Download |
| Supplementary_Table_12 | Meta-analysis GENE2FUNC enrichment. All enrichment results derived from GENE2FUNC (http://fuma.ctglab.nl), containing all results “GENE2FUNC_All_Enrich_Result” and only those from the GWAS Catalog and Canonical Pathways “GENE2FUNC_GWAS_&_CanonicalPath” that we used for the study. In addition, the gene expression (GTEx v7) analysis for general tissues (“GTEx_v7_GeneralTissue_DEG”) and specific tissues (“GTEx_v7_SpecificTissue_DEG”) differential expression groups are provided. Table includes the category identifier, the gene set or specific pathways, the number of genes in the gene set, the number of genes associated to meta-supported variants present in the gene set, the p-value, the Benjamin-Hochberg correct p-value, and the HUGO or ENSEMBL ids for all of the meta-supported genes in said gene set. | Download |
| Supplementary_Table_13 | Bi-directional Mendelian randomization results. Mendelian randomization (MR) results for MT of disease phenotypes and disease of MTs are provided. For MT of disease only a single SNP was used as the instrument, so Wald Ratio results are presented for those MT in Table 1 and for Bifidobacterium AB separately. Tables include the exposure (MT) outcome (disease) the number of SNPs used as instruments, the model, and parameter estimates beta (presented as log odd ratios for binary outcomes and standard deviation units of change for continuous), standard error and p-value. Disease-on-MT MR analysis include results for inverse variance weighted, weighted median, weighted mode, and MR Egger methods, as well as additional results tables for Heterogeneity and Pleiotropy sensitivity analysis. | Download |
| Supplementary_Table_14 | SNP rids for all genetic variants used to proxy disease phenotypes in MR analyses. | Download |
| Supplementary_Table_15 | Core microbial taxa in the FGFP dataset, given a prevalence value of 95%, or being present in 95% of all individuals sampled in FGFP. | Download |
| Supplementary_Table_16 | Prevalent, but low abundant taxa. This table contains taxa with prevalence over 50%, but average abundance levels below 40, a value previously shown to indicate poor replicability in rarefaction data. | Download |
| Supplementary_Table_17 | FGFP cohort summary statistics for analyzed taxa. Table includes taxon name (taxa), mean abundance (mean), standard deviation, Shapiro’s W-statistic for the raw, log2, and rank normal data transformed distributions, and accompanying p-values for the Shapiro normality test. In addition, the proportion of individuals with zero counts (equivalent to 1-prevelance) and a flag (0 = no, 1 = yes) declaring if a taxon should be processed through the 2-step hurdle binary (HB) model, including a P/A and zero-truncated abundance trait. Finally, for HB taxon there is also an estimate of the zero-truncated mean abundance and its standard deviation. | Download |
| Supplementary_Table_18 | Cohort microbiome summary statistics. The taxa in FGFP, FOCUS and PopGen are included, with information on their mean abundances, standard deviation, Shapiro’s W-statistic for the raw, log2, and rank normal data transformed distributions, and accompanying p-values for the Shapiro normality test. In addition, the proportion of individuals with zero counts (equivalent to 1-prevelance) and a flag (0 = no, 1 = yes) declaring if a taxon should be processed through the 2-step hurdle binary (HB) model, including a P/A and zero-truncated abundance trait. Finally, for HB taxon there is also an estimate of the zero-truncated mean abundance and its standard deviation. | Download |
| Supplementary_Table_19 | DEPICT gene enrichment results for individuals MTs. This table includes GO, KEGG, Reactome, and Ensembl gene subnetworks. The gene set ID and functional category source along with description of the functional category gene set are included. | Download |
| Supplementary_Table_20/td> | Tissue enrichment results for individuals MTs. Tissue specific DEPICT enrichment, MeSH refers to Medical Subject Headings. | Download |
| Supplementary_Table_21 | DEPICT gene priority enrichment results for individuals MTs. All variants with a p-value less than 1x10⁻⁵ in the initial FGFP GWAS screen are included. | Download |
| Supplementary_Table_22 | Garfield enrichment results for MTs. Tissue specific epigenetic regulatory function enrichment analysis derived from GARFIELD using FGFP variants at an association smaller than p-value of 1x10⁻⁵. The table includes MT identifier, odds ratio, p-value, Benjamini-Hochberg correct p-value, along with the specific regulatory annotation, cell type, tissue and epigenetic category of the association. | Download |
Abstract: https://www.nature.com/nmicrobiol/
Full Text: https://www.nature.com/nmicrobiol/
The full analysis pipeline for (i) microbiome processing; (ii) genotype quality control and imputation; (iii) genome-wide association analysis and (iv) phylogenetic analysis, is available here:
Data can be downloaded from the following link (110 Gb):
https://doi.org/10.5523/bris.22bqn399f9i432q56gt3wfhzlc
The process of enquiry for data access are as follows: Upon data request by email to jeroen.raes@kuleuven.be, the FGFP data access committee will evaluate access permission, which will be granted upon signature of a data use agreement between the governing legal entities.